
Preface
Since Java programs run on the JVM, Java’s use of computer memory has to be scheduled and managed through the Java Memory Model. You often see technical articles talking about it. I usually treated it as something interesting to learn about, never really planning to go deep—until I ran into multithreading…
Multithreading is truly something you both love and hate. It can solve a lot of problems, but if you don’t use it properly, it often leads to all kinds of production issues where you just can’t find the root cause. A big part of that is not understanding the Java Memory Model. Below I’ll talk about my understanding of the JVM starting from the JVM Runtime Data Areas.
Runtime Data Areas (JDK8)

I really don’t want to rant about Metaspace vs PermGen, but I have to. A lot of blogs just copy images and text back and forth, which forced me to dig through tons of material when I tried to understand the JVM—because many articles online are seriously misleading.
Let me sort out the changes in the runtime data areas across JDK 6/7/8 (if you’re not familiar with RDA, skip this part first and come back later).
- Before JDK7, the Method Area was implemented by PermGen (Permanent Generation). PermGen stored literals (interned strings), static variables (class statics), and class loading metadata.
- Starting from JDK7, the Method Area implementation didn’t change, but what it stored did. To prevent Method Area OOM, literals and static variables were moved into the Java heap. It only stored class loading metadata, and since classes are determined at compile time, the size is fixed—so no GC is needed and there’s no OOM.
- Starting from JDK8, the Method Area implementation changed to Metaspace. The biggest feature is that Metaspace is not in the JVM memory anymore—it uses native memory.
- ps: Metaspace is essentially similar to PermGen; both are implementations of the Method Area defined in the JVM specification.
Now let’s introduce some components of the JDK8 runtime data areas:
- Metaspace: as mentioned above, this part stores some compiled class bytecode metadata.
- Java Stack: stores thread-private data for each thread. The basic unit is a stack frame; each stack frame corresponds to a method. Since it’s a stack, it’s LIFO: all methods are pushed onto the stack and popped one by one. The earliest method is at the bottom. Each stack frame maintains a local variable table (because local variables belong to the method, so each method has its own table—if it’s an object, it mainly stores a reference), an operand stack, method return info, etc.
- Native Method Stack: similar to the stack above, but it serves native methods (written in C/C++).
- Program Counter Register: since there are so many stacks (i.e., so many threads), and threads execute by competing for time slices, during a context switch how do we know which stack frame we were executing? This is recorded by the program counter. It’s also thread-private. It records the address of the currently executing bytecode instruction; when the CPU switches back, it reads it and continues execution.
- Heap: this place is a concurrency nightmare. The stacks above are thread-private, so they’re safe under concurrency. But the heap is accessible by all threads; everyone stores objects here. A common way to understand it is: basic types are allocated on the stack, and other types are allocated on the heap—each thread’s local variable table stores the address (reference) to the object on the heap. The heap is a key area managed by the garbage collector.
JMM
According to the explanation in Understanding the Java Virtual Machine, main memory, working memory, and the Java memory areas (Java heap, stack, method area, etc.) are not the same level of memory partitioning. If you really have to map them, based on the definitions of variables, main memory, and working memory: main memory mainly corresponds to the instance data part of objects in the Java heap, while working memory corresponds to part of the virtual machine stack. So first, you need to understand the difference between JMM and the runtime data areas.
The Java Memory Model mainly consists of three parts: 1 main memory, n threads, n working memories (one per thread). Data is moved back and forth among these three. How does it move? Through the 8 atomic operations provided by Java: lock, unlock, read, load, use, assign, store, write
The flow of a variable in JMM is:
读   【主内存】 -> read -> load -> 【工作内存】 -> use -> 【Java线程】
写   【Java线程】-> assign -> 【工作内存】 -> store -> write -> 【主内存】
Each thread has its own thread stack. This stack contains the information and content related to what the thread calls. A thread can only access its own stack, and local variables created by a thread are invisible to other threads—only visible to itself. This means if two identical threads execute the same code, they will execute in their own stacks and copy out two separate sets of local variables.
Computer Hardware Memory Architecture
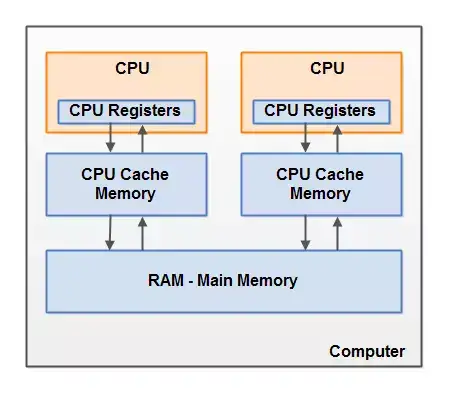
- CPU: the “computing brain”. Most data needs to be brought into the CPU for computation, and data is read upward from the layers below.
- Registers: the CPU executes operations on registers much faster than on main memory, because CPU access to registers is far faster than access to main memory.
- Cache: usually three levels of cache. Each level is slower than the previous one, but all are relatively small. CPU access to cache is faster than access to main memory, but usually still a bit slower than access to internal registers.
- Memory: also called main memory. This has the largest capacity and the most interaction—basically the RAM sticks you can replace/upgrade.
Modern computers still use the Von Neumann model. As shown above, for the CPU to read data and compute, it needs to fetch data from memory, load it into cache, and then load it into registers. Only registers can match the CPU’s computation frequency. Typically, when a CPU needs to read main memory, it reads a portion of main memory into the CPU cache. It may even read part of the cache into internal registers, and then perform operations in the registers. When the CPU needs to write results back to main memory, it flushes the register values into the cache, and then at some point flushes them back to main memory.
Afterword
One thing worth noting: JMM is a specification—an abstract concept. It’s not that there is some physical “region” that is JMM. Someone might ask: what exactly is this “local memory” area? It’s not a fixed region either; it covers caches, write buffers, registers, and other hardware and compiler optimizations.
This is actually a series. This post only talks about the Java memory model and the computer memory model. To go deeper, you need to combine it with real scenarios. Later I’ll cover a lot of concurrency-related content, like shared memory, volatile, atomic classes, and so on.
References
- http://tutorials.jenkov.com/java-concurrency/java-memory-model.html
- http://www.duokan.com/reader/www/app.html?id=478661cfaf9c4c05860806e6ea087962
- http://itmyhome.com/java-concurrent-programming/java-concurrent-programming.pdf
All articles in this blog, unless otherwise stated, are licensed under @Oreoft . Please indicate the source when reprinting!